I recently switched my backup process to use Restic and Backblaze .
Lucky for me I never needed to exercise my old process because I found it had been
broken for many months without me noticing. 🤯 Earlier this year I moved from docker to podman and while
all of my apps were successfully migrated I had missed a backup script which executed a docker run ... command. 🤦
This time I wanted to ensure I had monitoring to get alerted when the backups fail.
Monitoring Approach with Prometheus
Since I use the Prometheus stack for my overall monitoring and alerting, this was my preferred approach for tracking and alerting on backup failures. I just had to figure out which pieces to use to instrument metrics from the backup process.
Node Exporter Textfile Collectors
Typically in a Prometheus set up, you’ll run the prometheus_node_exporter on every node you are monitoring.
This process gathers metrics on a host and exposes it via an HTTP endpoint for Prometheus to collect. By adding
a textfile collector, you
can drop metrics from a script to a file on disk. These will then be monitored by node exporter and exposed to Prometheus.
Enable the collector by creating a directory for the files and add a startup arg to monitor that directory.
On Debian 12 this can be done by creating a new directory such as /var/lib/prometheus/textfile-collector
and then editing /etc/default/prometheus-node-exporter to include
ARGS="--collector.textfile.directory=/var/lib/prometheus/textfile-collector".
You can also do this in Ansible via:
- name: Install node_exporter
  apt:
    name: prometheus-node-exporter
    state: present

- name: Create textfile collector dir for custom metrics
  file:
    path: /var/lib/prometheus/textfile-collector
    state: directory

- name: Enable textfile collector on startup
  lineinfile:
    path: /etc/default/prometheus-node-exporter
    regexp: "^ARG="
    line: ARGS="--collector.textfile.directory=/var/lib/prometheus/textfile-collector"
Writing Metrics on Backup Success
Now that we have a monitored directory, we can write metrics on successful backup completion. In my backup script I’ve added a few things.
- Set the backup script to exit on any failure by adding
set -eto the script. This will ensure the backup script exits on any command failure. - Create a template file which we will use to generate our metrics - store in something like
backup-metrics-template.prom.# HELP backup_last_completion_timestamp_seconds Unix timestamp of the last backup job completion. # TYPE backup_last_completion_timestamp_seconds gauge backup_last_completion_timestamp_seconds{app="$APP"} $TIMESTAMP # HELP backup_duration_seconds Duration of the last backup job in seconds. # TYPE backup_duration_seconds gauge backup_duration_seconds{app="$APP"} $DURATION - At the start of the backup script (or in calling cron job), add a few vars to track our app name and backup start time.
export APP=syncthing export START_TIME=$(date +%s.%N) - Add a function in the script to write metrics to our textfile collector. Note the use of
envsubstto generate the output file by combining the template with the environment vars we’ve exported. We write to a temp file and then move the file to ensure a partially written file is never seen by node exporter.log_metrics() { METRIC_FILENAME="backup_${APP}_status.prom" TEMPLATE_FILE="/<PATH_TO_BACKUP_DIR>/backup-metrics-template.prom" NODE_EXPORTER_DIR="/var/lib/prometheus/textfile-collector" TEMP_METRIC_FILE="${NODE_EXPORTER_DIR}/${METRIC_FILENAME}.tmp" FINAL_METRIC_FILE="${NODE_EXPORTER_DIR}/${METRIC_FILENAME}" END_TIME=$(date +%s.%N) DURATION=$(echo "$END_TIME - $START_TIME" | bc -l) # Create env vars used by metrics in addition to $APP which is already exported export TIMESTAMP=$(date +%s) export DURATION=$(printf "%.2f" "$DURATION") # Generate our metrics file and atomically move it to the final destination cat "$TEMPLATE_FILE" | envsubst > "$TEMP_METRIC_FILE" mv "$TEMP_METRIC_FILE" "$FINAL_METRIC_FILE" } - At the end of your backup, call the function to write the metric. Because the script exits on failure,
we should only get here if it is successful.
.... DO THE BACKUP ....
log_metrics
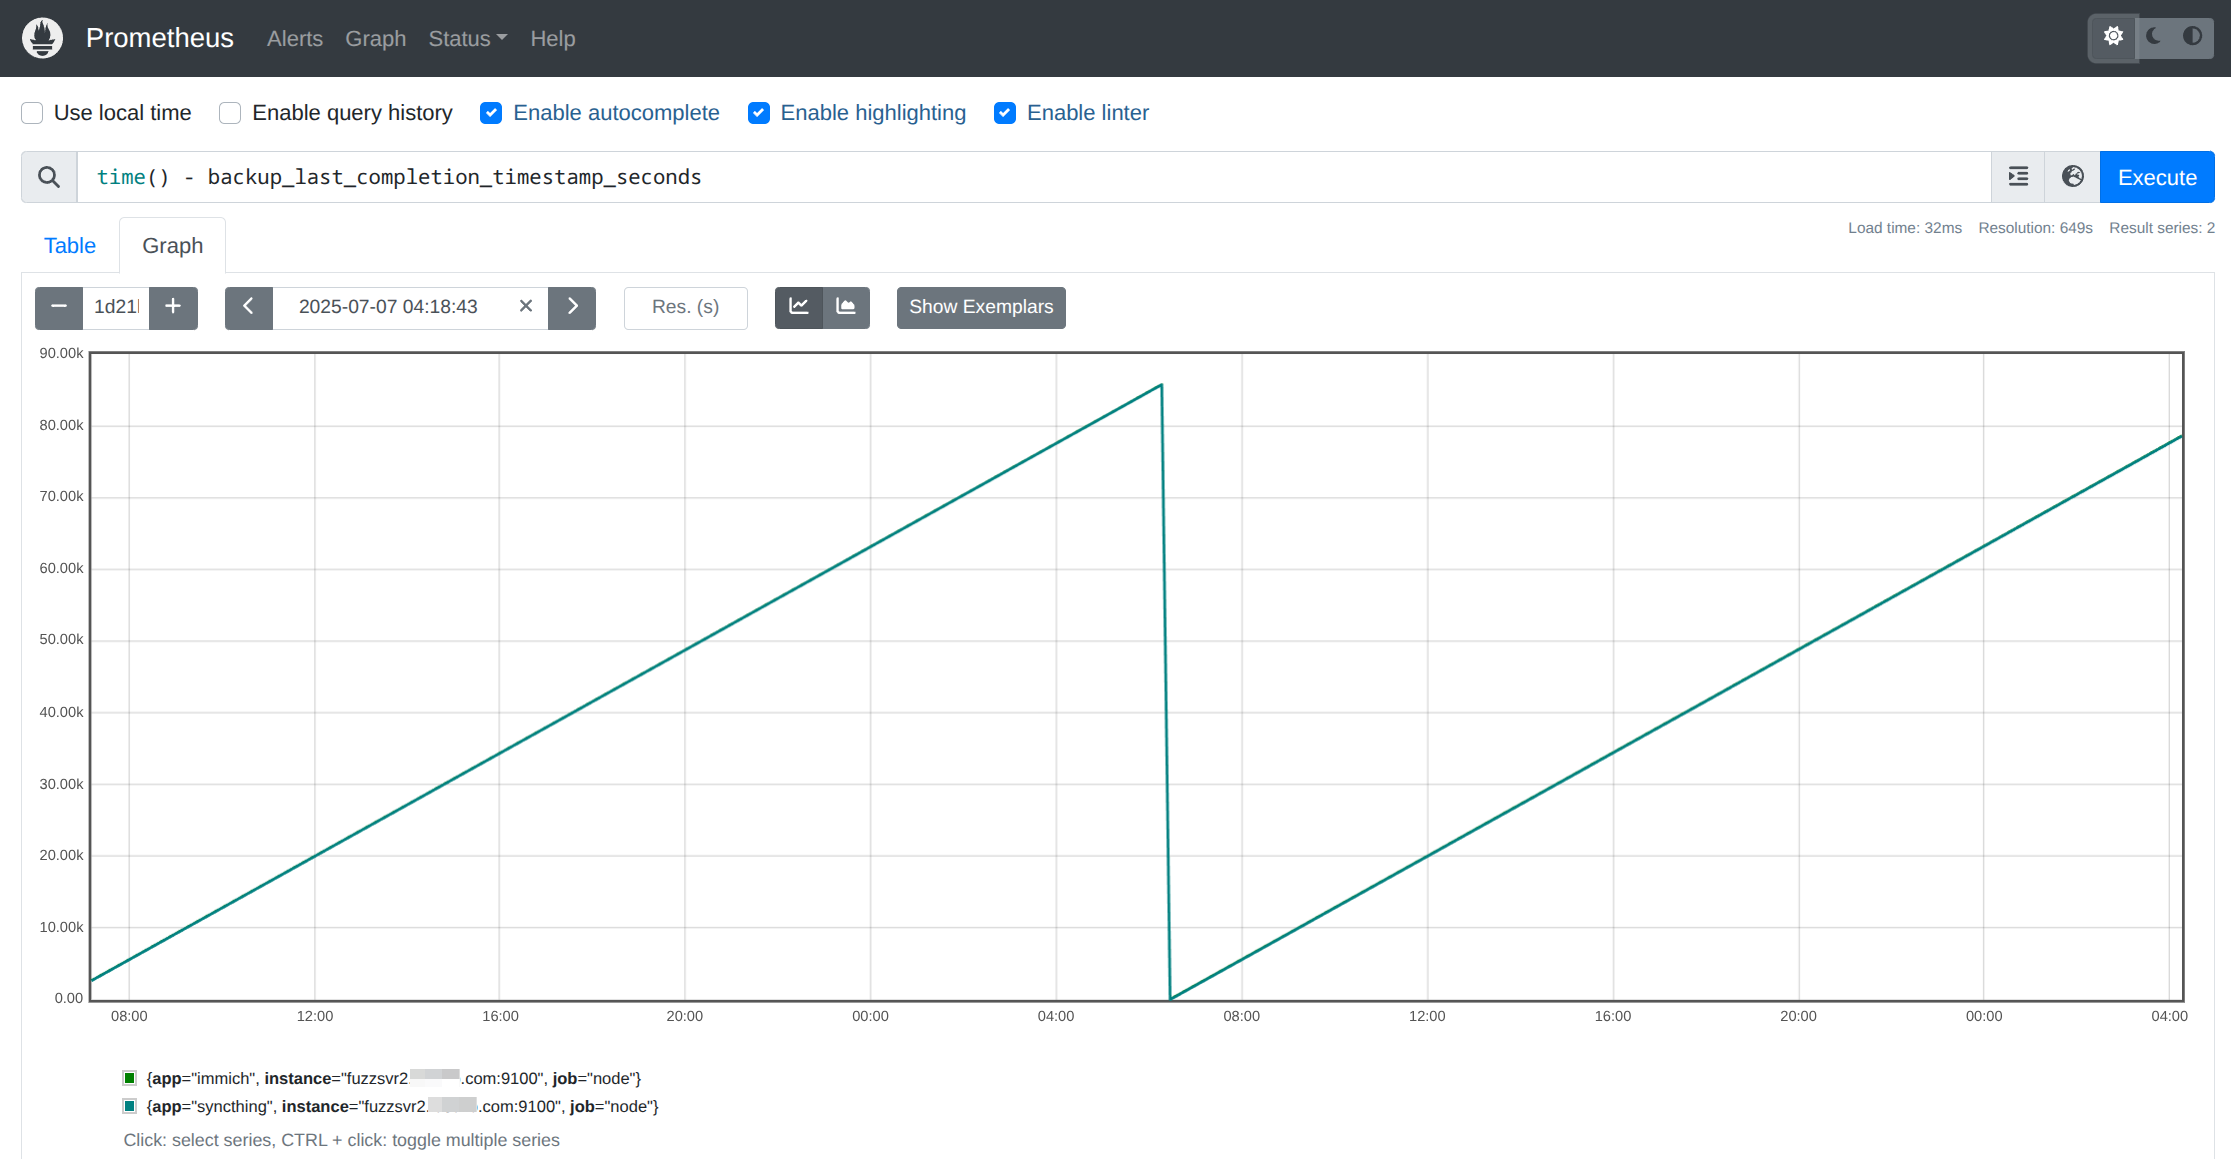
Prometheus Metrics
Confirm that your new backup metrics are appearing in Prometheus and tracked over time. They should look something like:
Prometheus Alerting
Now that we have a metric for the last successful backup time, we can set up an alert to get notified if it is more than a certain threshold in the past. In my case I wanted to ignore any single failure, but get notified after two in a row.
groups:
- name: alert-rules
rules:
....
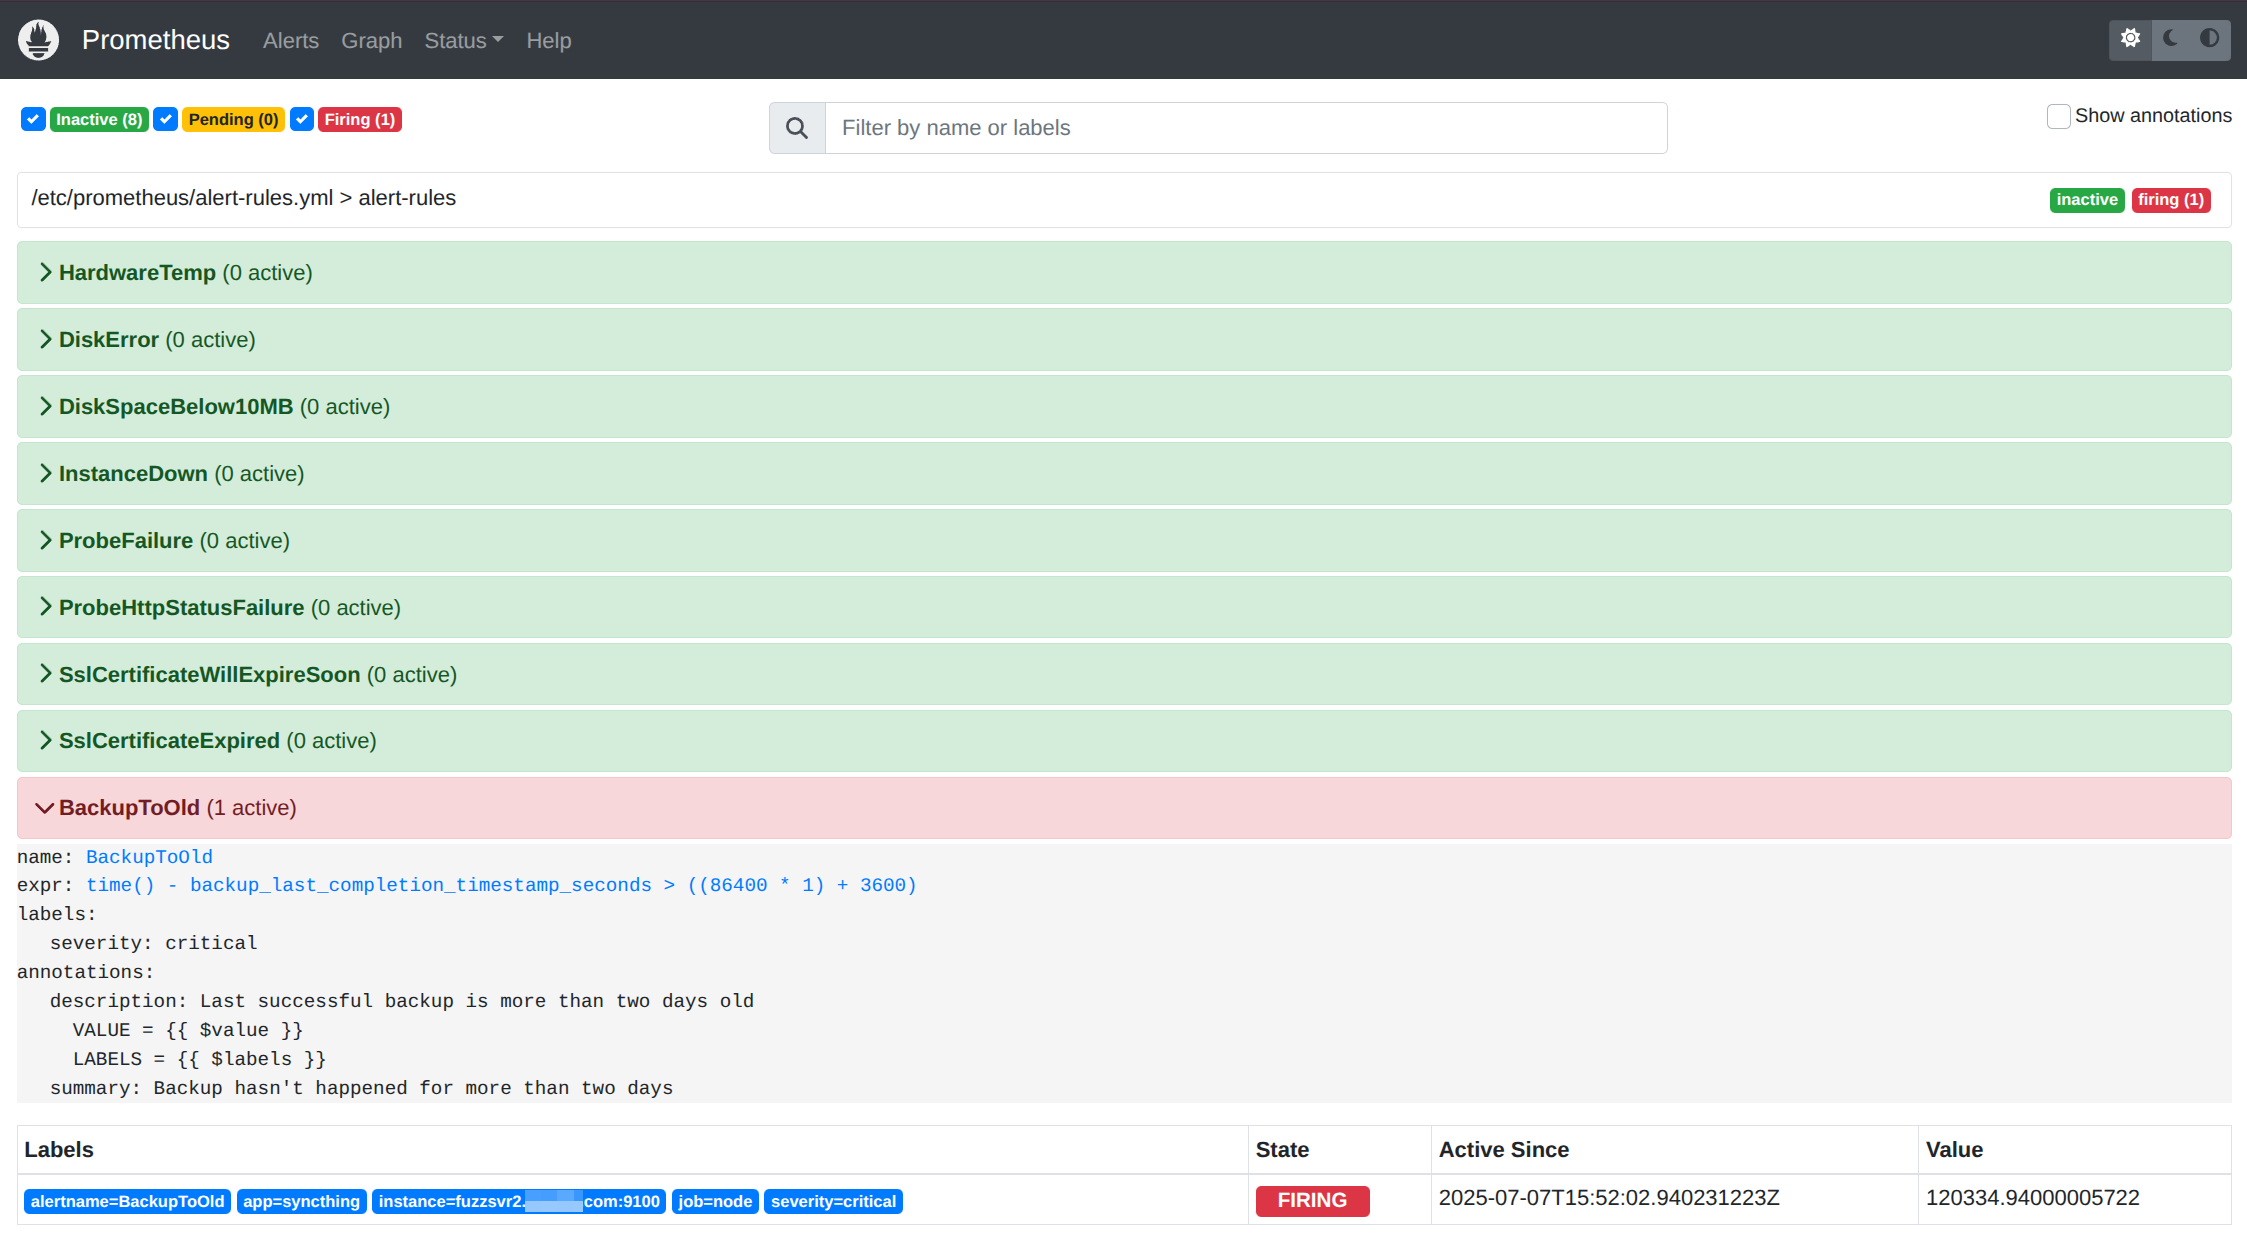
- alert: BackupToOld
# Get notified if backups are older than 2 days + 1 hour in seconds
expr: time() - backup_last_completion_timestamp_seconds > ((86400 * 2) + 3600)
for: 0m
labels:
severity: critical
annotations:
summary: "Backup hasn't happened for more than two days"
description: "Last successful backup is more than two days old\n VALUE = {{ $value }}\n LABELS = {{ $labels }}"
Testing
Once your backups have been working smoothly, do something to break them and confirm you are notified. Since one of
my backups runs an rsync from another host, I removed the remote host from the ~/.ssh/known_hosts file to cause
the rsync command to fail.
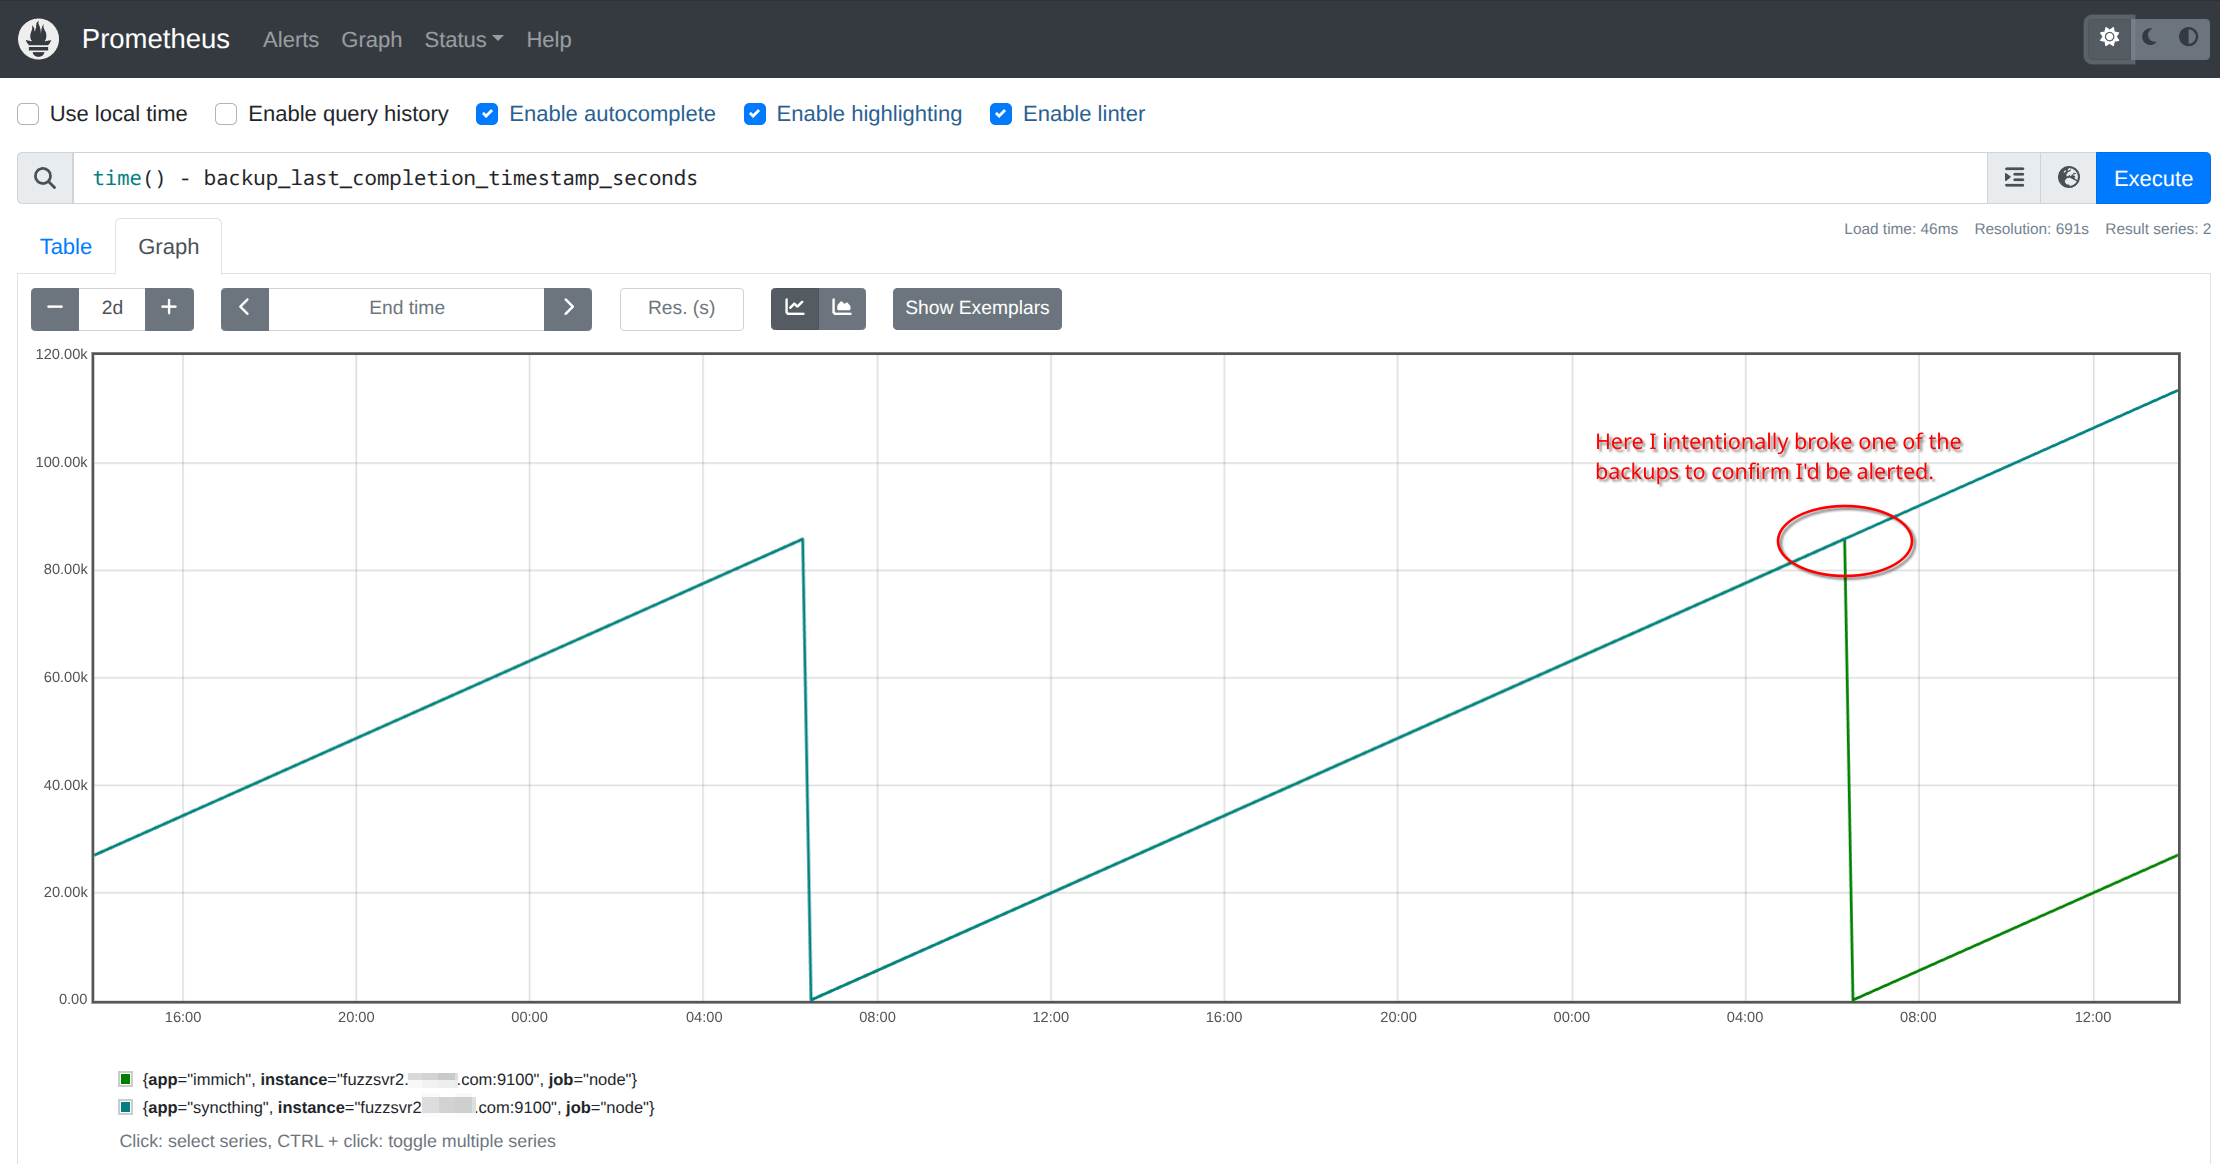
And we can see the alert in Prometheus (I dropped the alert to one day temporarily to test).
Wrap up
This is a simple example of how to get notified when your backup process fails. Just remember, even though your backup process is successful, it doesn’t necessarily mean it backed up everything correctly. I would still suggest you continue to test that the backups themselves are valid by doing a restore and validation on a regular cadence.